Is Ruby Dying?
Written by John Moses on December 21, 2013
I have been working with nodejs alot lately and have been discussing with coworkers if nodejs is taking steam away from ruby at all. I think the popularity of the language is an important talking point when selecting a language and framework for a new project.
I think a graph on the release date of gems over time could help determine an answer. The front page of rubygems only shows data on the most popular, but I am really interested in seeing recent activity. My theory is that if developers’ contributions to different gems is slowing down, then so is the popularity of the language.
Getting the data
After a little searching, I was unable to find the data in the
format necessary for putting together a graph. And anyway, I was
interested in scraping the site. My tool of choice is the nodejs
cheerio library. The
gem executable can give us a list of each gem by running gem list
--remote. Fortunately, each gem has its own homepage with a
nice URL. e.g. Rails can be found at http://rubygems.org/gems/rails
1
2
3
4
5
6
7
8
9
10
11
12
13
14
15
16
17
18
19
20
21
22
23
24
25
26
27
28
29
30
31
32
33
34
35
36
37
38
39
40
41
42
43
44
45
46
47
48
49
50
51
52
53
54
55
56
57
58
59
60
61
62
63
64
65
66
67
68
var request = require('request'),
    cheerio = require('cheerio'),
    bytes = require('bytes'),
    sys = require('sys'),
    fs = require('fs'),
    exec = require('child_process').exec;
console.log('program begin: ' + new Date());
fs.openSync('out.csv', 'w');
exec("gem list --remote", { maxBuffer: 20000*1024 }, processGems);
function processGems(error, stdout, stderr){
    var gems = stdout.split("n");
    console.info('total gems parsed: ' + gems.length);
    gems.forEach(function(gem){
        gem = gem.substring(0, gem.indexOf('  '));
        console.info('crawling gem: ' + gem);
        request({
            uri: 'https://rubygems.org/gems/' + gem,
        }, getContent);
    });
}
function parseSize(size){
    size = size.replace('  ', '');
    size = size.replace(/)|(/g, '');
    size = size.toLowerCase();
    try{
        size = bytes(size);
    }
    catch(e){
        console.error('unable to parse :' + size);
    }
    return size;
}
function escape(s){
    if (s.indexOf('"') != -1) {
        s = s.replace(/"/g, '""');
    }
    if (s.match(/"|,/)) {
        s = '"' + s + '"';
    }
    return s;
}
function getContent(error, response, body){
    if (error && response.statusCode != 200) {
        console.error(error);
        console.error(response);
        return;
    }
    console.info(response.request.href + ' complete, status: ' + response.statusCode);
    var $ = cheerio.load(body),
        gem = $('div.title h2 a').text(),
        latest = $('div.versions ol li').last(),
        version = $(latest).children('a').text(),
        date = $(latest).children('small').text(),
        size = $(latest).children('span.size').text(),
        line;
    line = escape(gem) + ',' +
        escape(version) + ',' +
        escape(date) + ',' +
        parseSize(size) + 'n';
    fs.appendFile('out.csv', line);
}
Cleaning the data
The resulting file is 2.7mb and can be found here. It is not in the format to make the graph I want. The graph I am picturing has the number of releases for that day on the y-axis and the release date on the x-axis. So I need two columns, the first with release date and the second with the number of releases on that day. The following nodejs takes the dumped csv and puts in the format I want.
1
2
3
4
5
6
7
8
9
10
11
12
13
14
15
16
17
18
19
20
21
22
23
24
25
26
27
28
29
30
31
32
33
34
35
36
37
38
39
var __ = require('lodash'),
    moment = require('moment'),
    csv = require('csv'),
    fs = require('fs');
fs.openSync('releasedate.csv', 'w');
csv()
    .from.path(__dirname+'/gems.csv', { delimiter: ',', escape: '"' })
    .to.array( function(data){
        var csv = '';
        var grouped = __.groupBy(data, function(gem) {
            return gem[2];
        });
        var array = []
        for(var gem in grouped) {
            array.push({
                date: escape(gem),
                unixtime: moment(gem, 'MMM D, YYYY').valueOf(),
                released: grouped[gem].length
            });
        }
        arraySorted = __.sortBy(array, 'unixtime');
        arraySorted.forEach(function(gem){
            csv += gem.date + ',' + gem.released + 'n';
        });
        fs.appendFile('releasedate.csv', csv);
    } );
function escape(s){
    if (s.indexOf('"') != -1) {
        s = s.replace(/"/g, '""');
    }
    if (s.match(/"|,/)) {
        s = '"' + s + '"';
    }
    return s;
}
Graphing in R
Perfect! Now to get graphing. My first thought is to use Excel, but when I try I find out that I can only create a graph with 255 points. That is not going to work as I have ~65k so I boot up R. The following two lines of R produce the line chart I want to see and remind me why I like to use R.
1
2
data<-read.csv('releasedate.csv')
plot(zoo(data$Released,as.Date(data$Date,"%m/%d/%y")),xlab="Release Date",ylab="Releases",main="RubyGems Release Date Trend")
The end result is a nice line chart showing the trend I am looking for.
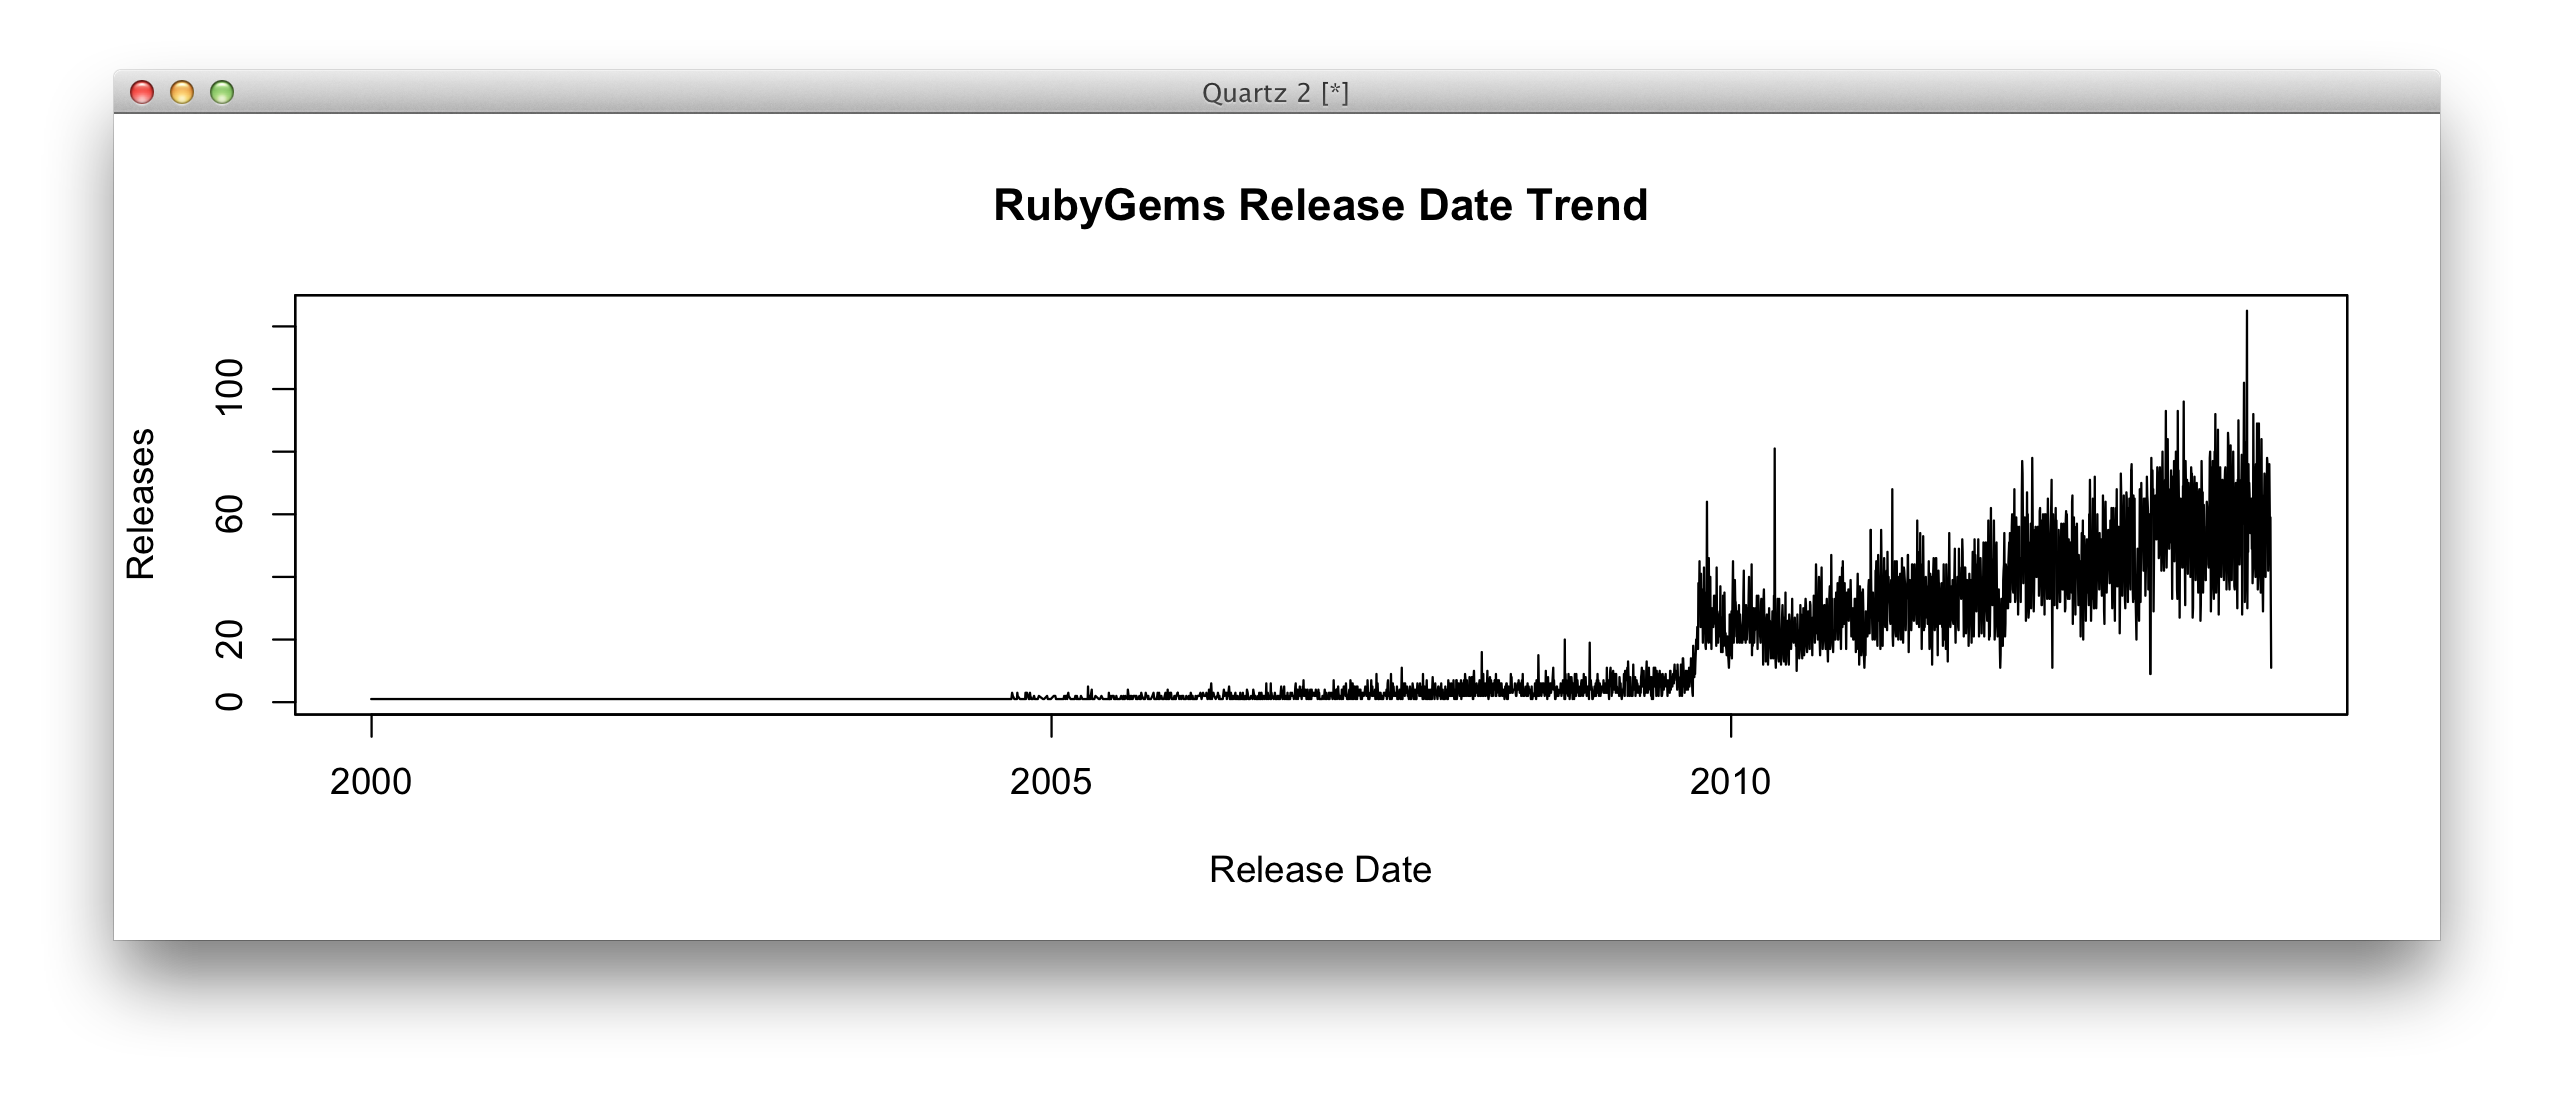
At first I am surprised. It does not appear to be slowing as I had thought. When I think more about it, it makes sense that the developers are still using gems:
- The Ruby meetup groups have a devout following and strong leadership
- There are several highly marketed learning resources online
- Rails makes it super easy to create a web application
What do you guys think? Is Ruby dying? Did you once use Ruby and have now started to use something else? Comments can be found over at Hackernews